Market Update – January 2018

Happy 2018! I’m back! It’s been a few minutes (well, more than that) since the blog has been updated.  I enjoy the process of creating my own content and with a new puppy (Sage, a sweet and spunky Golden Retriever) at the end of 2015 and a running accident in 2016 (a tree fell on me, long story) … this took a back seat.

2017 proved to be another dynamic and record breaking year for the Greater Seattle real estate market. According to the NWMLS (Northwest Multiple Listing Service), the 2017 inventory shrunk 19 percent, from 10,569 active listings at the end of 2016 to 8,553 as of December 2017. That’s the smallest selection for any month in the past decade. For the fourth time this year, monthly inventory dipped below the 10,000 mark, a level not reached at any other time during the 10-year comparison. So, what does this mean?

Trendgraphic

At the beginning of December 2017, inventory was at 0.7 months supply.  If no additional homes were listed in December, it would take a little less than 20 days for all inventory to be eaten up by hungry buyers.  By the end of December, 0.7 had dwindled down to 0.58 months supply.  The topic of “low inventory” has become a common theme over the past few years, it seems like each year we have reached a new “record low”.  At this point, it’s par for the course and unless there is a major economic or political event (which is entirely possible), the pattern will likely continue into 2018.


TGChartImage.png

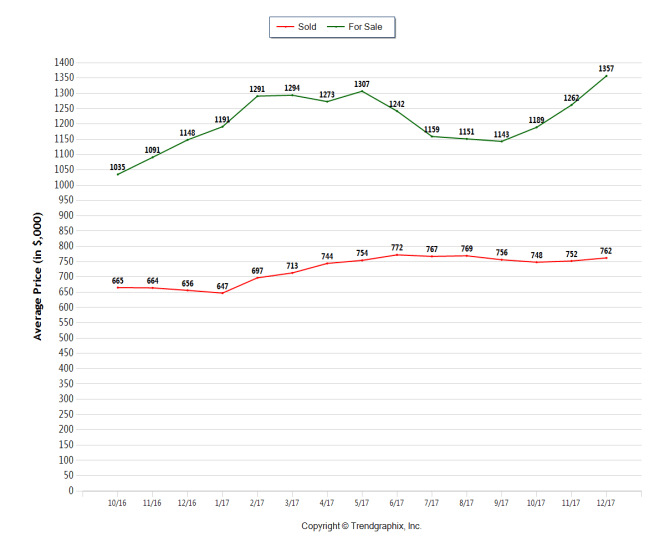
As you can see, the average for sale price is on the rise in King County while the average sold price is hovering around 750k.  The discrepancy between average for sale and average sold is likely due to the new construction inventory.  The median (middle number of the pack) sale price in December 2017 for King County was $635,000.

If you haven’t seen it,  here is an interesting article by the Seattle Times: Eastside home prices break record; Capitol Hill area hits $1 million median

What does this mean for those thinking about buying or selling a home?  For buyers and sellers both, it’s all about supply and demand, in which there is a huge discrepancy currently.  As a seller, it is imperative to strategically position your home in the market to maximize exposure and sale price.  There are unique challenges as a seller in this market and will be specific to a number of different factors.  As a buyer, having all your ducks in a row and knowing your strategy is imperative to success.  Yes, it is a competitive market and may take some time, and that’s okay (if you have the time).  My unsolicited advice is: don’t listen to the hype, everyone has an opinion.  It is amazing what can happen when you stay focused on your goal, cut out the noise and take the next indicated step in getting where you want to be.

Happy 2018 peeps and it won’t be another year until you hear from me again!


Advertisement

Market Monday’s: Pricing in a Seller’s Market

What is my home worth?  It’s the question most home owners have and arguably the most important factor when deciding to sell a home.

In today’s hot seller’s market, where in King County there is a 1.4 months supply of inventory and a typical balanced market would be considered somewhere between 4 and 6 months supply.  According to a the most recent press release by NWMLS,  “Single family home prices across the 23 counties in the MLS report rose nearly 7.6 percent from a year ago, from $297,500 to $320,000. Single family homes in King County commanded the highest median price at $490,250, up 6.6 percent from the year-ago figure of $460,000, but down from June’s high of $500,000”.  Interestingly, 2,600 listings have expired this year in King County alone…the most common influencing factor? Overpricing.  Yes, it’s a sellers market but properties that sold for the most were strategic in pricing, ultimately attracting the most buyers when the property was most relevant and visible.  With all the valuation tools available to consumers (read 10 appraisals vs. Zestimates), below are some ways to take matters into your own hands and have a realistic look at your market area, ultimately helping you get the most for your home.

  • Study past sales. This is the starting point for any thoughtful and successful pricing strategy; think of it as the “science” part. Take the time to study past sale statistics for homes in your area and areas similar to yours. None will be identical, of course, but having a clear understanding of true market value is the first step in establishing your list price.
  • Do not confuse active listings with past sales. Active listings have not sold. They are just your competition. It is important to be aware of your competition’s pricing, but this is often just an indication of what your home won’t sell for.
  • Do not overprice because you have “time.” If the market is appreciating, this strategy may work, but if prices in your area are declining, you may quickly find yourself chasing a market and costing yourself money. And if the market is stable? Your home will just sit. Buyers pay in today’s dollars, and time is rarely on your side.
  • Leave some room for negotiation, but don’t overreach. No seller wants to feel he left money on the table, and no buyer wants to overpay. Your price should give both parties room to maneuver, but if it is too high, you risk being perceived as unrealistic, and buyers will pass over your home.
  • Think like a buyer. What are the things that you value in a home? Is it a large yard, an updated kitchen or a view? These are likely the same things that your buyer values as well. Talk to your agent about current buyer trends. Yesterday’s avocado green shag carpeting is today’s granite counter top. The property facing the interstate is going to be a tougher sell than the one with a mountain view. Your price should reflect how your home compares to the others offered for sale. Buyers will find objections to any home, as none is perfect, but it is curious how quickly objections disappear when the price is compelling.
  • React swiftly and decisively. If your home is on the market and is not being shown or if you receive feedback that you are priced too aggressively, don’t hesitate to adjust your price immediately!

First impressions are everything when selling your home. Studies have shown that the first two weeks on the market are the most crucial to your success. During these initial days, your home will be exposed to all active buyers making pricing and timing that much more critical.  If your price is perceived as too high, you will quickly lose this initial audience and find yourself relying only on the trickle of new buyers entering the market each day. Markets are dynamic, and your price has an expiration date. You have one chance to grab attention. Make sure your pricing helps you stand out on the shelf — in a positive way.

Oh, and here is a little infographic courtesy of Pinterest to help spruce up your curb appeal….

Tips for Selling Your Home; Curb Appeal. Curb appeal can mean the difference between a home that sells quickly for the asking price, and a home that sits for months on the market, below asking price.  #lakegeneva #fontana #curbappeal. http://agents.keeferealestate.com/michalene_melges/:

Market Monday’s: Holiday Edition

Happy Monday Everyone! Alright, so I’m veering off the path a little bit this week in the spirit of the HOLIDAY SEASON! I was inspired to do a Christmas edition post this week after driving through some neighborhoods on our way home from the movies last night and seeing some beautiful light displays! One of my favorite parts of the holiday season are all the lights…on trees, houses, boats, people…the more the better, especially during the time of year with the least daylight.  What better way to find out the personality of your future neighborhood than seeing what people are doing during the Holiday season?! Below are some of the best neighborhoods in the greater Seattle area for Christmas light displays.  Enjoy!

1. Candy Cane Lane in Ravenna (December 15 to New Year’s)
This is by far the best one to drive through in Seattle for charming Christmas light displays. It’s a free light display that you can walk or drive through in a loop put on by the neighbors of Park Road and Ravenna Boulevard. The neighborhood has been putting on this community light show since 1941. (December 15 through New Year’s Day from 4 p.m to 11 p.m.; on Christmas Eve, Christmas Day and New Year’s Eve the lights are on until midnight). Address: Northeast Park Road, off Ravenna Boulevard, Seattle, WA 98105

2. Olympic Manor near Greenwood (Mid-December)
The Olympic Manor neighborhood in Seattle has it in their homeowners association rules that they are encouraged to decorate for Christmas each year. Dozens of homes are decorated and it’s a longtime holiday favorite in Seattle. Don’t be surprised to see limos driving through. Address: Start at Northwest 85th Street and 23rd Avenue Northwest.

3. Kerry Park Viewpoint on Queen Anne Hill (Month of December)
After driving through to see the Christmas displays of the picturesque homes on Queen Anne Hill head to the Kerry Park Viewpoint for the best view in town of the lighted tree a top the Space Needle. It’s free too. Address: 211 W. Highland Dr. Seattle, WA.

4.  Keener’s Christmas light display in Bothell located at 16504 112 Place, Bothell,,WA 98011 boasts an impressive description of:

” Over 100,000 lights,Over 30 retro blow molds,15 ft high arch way with 4000 green and red lights over the drive way, 3 nativity scenes, 20 ft snowman, 75 percent Of the display is LEDs, Christmas Yoda floating in a tree, Santa and his reindeer taking flight, 9 blow ups, Over an acre and half lit up”.  Also, the Keener’s offer this festive experience free of charge, however, they accept donations on behalf of the Ben Towne Foundation, which fights childhood cancer.  More information is available on their website and they are willing to match all donations of up to $3000!

Do you have a favorite neighborhood light display? There’s still plenty of time to feature your own neighborhood so email me at rachelwagner@johnlscott.com with a photo and what you love about your neighborhood this Holiday season.

Market Mondays: Kirkland/Bridle

simple_tranquil_living_logo1.jpg

Happy Monday! Can you believe it’s already December 1st? I hope everyone had a wonderful Thanksgiving and is ready to finish out 2014 strong! It has been an exciting year in the real estate market and this week we are looking at what’s happening with single family homes in the Kirkland/Bridle area.

As of December 1st, 2014 there are 90 active listings (115 when pending sales are included) ranging from $285,000- $3.7 million with a median listing price of $939,000.  When we look at sold homes, there have been 166 sales in the past 90 days, ranging from $225,000- $7.75 million with a median sale price of $830,000. The graph below demonstrates the average days on market as well as the sale price to list price ratio.

When you compare October 2013 to October 2014 (the most recent up to date data), we see a slight decrease in the sale price to the original list price and a huge increase in inventory.  What this graph fails to show is that the average sale price has gone up 57%, from an average sale price of $667,000 in October 2013 to an an AVERAGE sale price of $1.5 million in October 2014.

As of today, there is 2.09 months supply of inventory when pending sales are included and 1.63 months supply of inventory when only active listings are included.  The market is seeing a shortage of inventory and there is still a backlog of buyers ready to jump at their perfect home.  If you are thinking of selling, now is a great time!

If you or someone you know has an interest in a specific area or market, please feel free to contact me at rachelwagner@johnlscott.com or call/text 425.324.0302. I am happy to answer any of your questions, as they relate to real estate! Have a great week!

Market Mondays: Kirkland Condos

Happy Monday!

simple_tranquil_living_logo1.jpg

The sun is shining, the leaves are falling and the holiday season is rapidly approaching.  This week, I will share with you a quick glance at the Kirkland condo market.  In the spirit of the holiday season, I will also be doing a post this coming Wednesday on some easy and fun holiday themed updates for your fireplace mantle, so stay tuned!

As of November 10, 2014 Kirkland has 59 active condo listings ranging from $138,000-$5.75 million, with the median listing price of $380,000.  In the last 90 days, there have been 86 condos sold with a sale price of $149,000-$3.15 million and median sale price of $516,000.  As you will see demonstrated by the graph below, Kirkland had 6 months supply of inventory (a balanced market), at the end of October.  However, as we approach the end of the second week in November, Kirkland is at 2.06 months supply of inventory based on closed sales.  Many homes that are now closed had more than likely gone pending in October, not reflecting in the months of inventory based on closed sales.  Its normal for the market to slow down a little in the fall and winter months…less light, holidays etc. have brought the Kirkland condo market down to a simmer, although things are definitely still clipping right along!

What will the median sale price of $516,000 get you in the Kirkland area?

The above property, a detached condo, sold for $516,000 in October, falling right in the middle of the pack with a little over 2,000 square feet and a beautiful floor plan.

If you, or someone you know are looking for condos in Kirkland, email me at rachelwagner@johnlscott.com.  As an avid runner and Kirkland resident, I am always out and about in the neighborhoods and absolutely love this area…I’m grateful to call it home.

Make it a great week!

Market Mondays: Bellevue Condos

Happy Monday everyone!

This week, I chose the Bellevue condo market to look at. As a resident of Kirkland, Bellevue is one of my favorite neighboring cities to explore and is a lovely place to live, raise a family as well as one of my favorite things to do: recreate.  The following are some interesting facts about Bellevue:

As of 2014, Bellevue’s population is 122,873 people. Since 2000, it has had a population growth of 8.69 percent!

——————–The median home cost in Bellevue is $554,300. Home appreciation the last year has been 12.50 percent.

——————–Compared to the rest of the country, Bellevue’s cost of living is 77.90% Higher than the U.S. average, wow!

——————–Bellevue public schools spend $12,674 per student. The average school expenditure in the U.S. is $12,435. There are about 19.3 students per teacher in Bellevue.

——————–The unemployment rate in Bellevue is 3.90 percent(U.S. avg. is 6.30%). Recent job growth is positive and continuing to grow. Bellevue jobs have Increased by 2.64 percent.

As of November 3, 2014 there are 90 active condo listings WEST of 405 in Bellevue.  The range is $189,000-$3.5 million with a median listing price of $890,000.  There have been 74 condos sold in the last 90 days, ranging from $184,950- $3.3 million dollars with a median sale price of $504,000 and 19 days on the market.  Based on the number of condos sold, Bellevue is looking at 3.6 months supply of inventory, however, when all pending sales are included, months of inventory drops to about 2.5.  There are currently 104 condos that have gone pending or sold in the last 90 days, ranging from $184,000- $6 million dollars!  The median pending/sold price is $689,000, the graph below displays the months supply of inventory through the end of September 2014.

As you may know from my previous posts, a balanced market is considered to be around 6 months supply of inventory, which puts Bellevue (and most areas in King and Snohomish County) in a position where there is a high demand for inventory and homes are selling quickly, although somewhat less so than what we saw earlier in the summer.

Currently, the number of condos for sale vs. sold for the month of November are up from both September and October.

Bellevue continues to see high list price/sale price ratio and demonstrates a range of average days on market, currently the median days on market are 25.  Most likely, the number of days on market reflects the inventory available and it’s subsequent price point.  Because these numbers vary slightly every month, or every day for that matter, it makes sense to see the fluctuations represented above.

Stay tuned for a post on “Kirkland Lifestyle” later in the week, I’m excited to share with you one of my favorite places to play and live.  Make this week a good one everyone!

Market Mondays: 2015 Economic Forecast

simple_tranquil_living_logo1.jpg

This week I have decided to step back briefly and look at the market from a macro level as well as discussing predictions for 2015 that were shared at a recent conference.  It’s interesting and exciting to see where the housing market is headed, as well as the economic health of the real estate market as we head into 2015.  Before I dive into that information, as of October 27th, 2014 King County is at about 2.6 months supply of inventory while Snohomish County is hovering around 3.1 months supply of inventory.  Those numbers are a 4.2% increase from October 2014 in King County and a 6.2% increase in Snohomish.  With interest rates at a 16 month low, it is a great time to get in there and take advantage of this market if you are thinking of buying or selling your home.

What is the state of the real estate market?  Well, we are currently down 10.6% nationally from peak values in 2006, however, we are slowly making our way back up as demonstrated by the graph below.

Displaying photo 1.PNG

Displaying photo 2.PNG

As demonstrated above, all but one top 30 metro areas show annual home value appreciation.  Seattle Metro leads the Puget Sound in annual home value gain at 8.3%, while other areas of the country who were drastically impacted by the recession are seeing a big jump in annual appreciation as well.

Displaying photo 3.PNG

Seattle Metro is currently down 11.5% from it’s peak, compared to the national average of 10.6%.

Displaying photo 4.PNG

Displaying photo 1.PNG

Although Seattle Metro is slightly below the national average, what we are seeing is a steady increase in inventory, resulting in a healthier and more sustainable market as well as softening the rate of appreciation (which is still significant, regardless).  The nature of markets are to rise and fall (think rolling hills), however, slow and steady is preferred over sharp inclines and falls.

Are you ready for some good news?

Displaying photo 2.PNG

According to the National Association of Realtors and as demonstrated by the Zillow Real Estate Research for Professionals tool, negative equity has declined steadily since quarter 1 of 2012, which is great news for home buyers and home owners alike.  However, negative equity remains at 17% nationally and is highest in the bottom value tier.  The number of homes underwater is above 25% nationally and 30% in the Seattle area.  The middle value tier is 13% and the top value tier is 6% in the Seattle area.  Although these numbers are declining annually, there are still many homeowners who are underwater, especially in the bottom value tier.

As we move into 2015, mortgage rates are expected to rise, with interest rates expected to reach the 5% mark (which is still fantastic, historically), while rent affordability is below the historical average on a national level.  Renter households are forming faster than owner households for the first time since the late 1980’s and the market is responding with higher rental rates and a shortage of available rentals while the market struggles to keep up with the demand.  (translation: don’t rent if you can buy!)

Displaying photo 3.PNG

Below are some year over year percent change forecasts for Snohomish County, by city.  Appreciation rates are expected to continue to gain, however, slightly less than in 2014.  With rental rates skyrocketing, as well as a shortage of available rentals and low interest rates, now is a great time to get into a home for a first time home-buyer.  Investment properties in the bottom value tier to generate rental income are also a great option, it’s an exciting time in the real estate market around the country.  Please contact me with any questions you have at rachelwagner@johnlscott.com or call/text 425.324.0302.  I am available to help with any of your real estate needs.

And in other Simple Tranquil Living news, the holidays are quickly approaching! Okay, so that may not be news to you, but here at Simple Tranquil Living we have a lot of fun with holiday festivities so stay tuned for a special Halloween post and perhaps another GIVEAWAY! Happy Monday everyone!  

Market Monday’s: Mercer Island

Aerial view of Mercer Island, the large island surrounded by Lake Washington. The smaller forested peninsula jutting into the lake from the Seattle mainland is Seward Park.

Mercer Island, with a population of about 23,000 people is a beautiful island city located on the southern tip of Lake Washington with Seattle located to its west and Bellevue to the east.

Who (which demographic) lives on Mercer Island?

“Urban Power Families” – High-income couples with children.Six-figure salaried couples with children who live an upscale life in a metro center. Highly educated professionals working in finance, medical, and high-tech fields.

“Corporate Climbers” – High-income, high-expense urban singles.Urban singles with an up-and-coming income, but with higher-than-average living costs. Most have college educations and are employed in mid-management professions.

“Suburban Retirees” – Seniors over 65 who live in the suburbs.These seniors are living out their retirement years in suburbia. Most own their homes, and some have college degrees.

“Suburban Elite” – Suburban super-rich couples with children.Middle-aged married couples with a luxurious lifestyle in the suburbs. More than 15% have a family income of $200,000 or more. The majority have a college or graduate school degree, and most own their homes.

“Multi-lingual Urbanites” – Urban dwellers who speak more than one language.Some have a high school or college education, and they work in a variety of occupations. Moderate to upper-scale earning potential.

Mercer Island has 71 active listings as of October 20, 2014 ranging from $250,000- $26.8 million! The median listing price is $2.1 million.  In the last 90 days, 87 residential homes and condos have been sold between $169,000-$7.5 million with a median sale price of $995,000.  Currently, Mercer Island has 2.4 months supply of inventory based on sold homes in the last 90 days.  However, only 15 homes were listed below one million dollars, the lowest number in nearly TWO DECADES! More inventory will be essential to creating a balanced market.

Buyers are also cautious of paying too much, the average sale price was up a modest 2% year-over-year while median sale price fell almost 9%.  This reflects more sales in the lower price range than during the same time last year.  The condo market, however, has seen a 47% increase in sale price when compared to 3rd quarter of 2013.  Perhaps we are seeing more “Corporate Climbers” moving into the area, seeing that the commute to Seattle and Bellevue are a breeze.

The graph above demonstrates the number of homes for sale/sold and pending monthly over the past year.

Months of inventory is down slightly for the month of October, however, like I mentioned earlier, many of the homes currently on the market are well above the $1 million mark and have been sitting on the market for significantly longer than the lower priced homes or condos.  Mercer Island is a beautiful place to live and no doubt a desirable location which consequently results in a smaller pool of buyers with the financial ability and lifestyle preferences Mercer Island provides!

Fall Checklist For Your Home

simple_tranquil_living_logo.jpg

Fall is the perfect time to take care of the little things that can make a big difference for you and your home.  Most of the tasks listed below are well with-in the average person’s ability and even if you choose to have a professional handle them, it’s worth the expense. You’ll save money as well as prevent a larger expense down the road.  A large piece of why I enjoy writing a real estate blog for my business is my love for sharing information and helping others, I am still amazed at how much I learn when I look into each topic.  If you have a topic you are interested in knowing more about or would like referrals for professionals in the area who do the following work, please email me at rachelwagner@johnlscott.com.

Check out those gutters!  Your roof’s drainage system annually diverts thousands of gallons of water from your house’s exterior and foundation walls. That’s why it is so important to keep this system flowing smoothly. Clogged gutters can lead to damaged exterior surfaces and to water in your basement. They are also more prone to rust and corrosion. Before the leaves fly this fall, have your gutters cleaned, then covered with mesh guards to keep debris from returning. A dry weekend like the one coming up is a great time to take care of this!

Video instructions on cleaning the gutter

Weatherize your home. A home with air leaks around windows and doors is like a coat left unbuttoned. Gaps in caulk and weather-stripping can account for a 10% of your heating bills, according to the U.S. Department of Energy.

Weather-stripping is easily the most cost-effective way to rein in heating and cooling costs. This material also reduces drafts and keeps your home more comfortable year-round. Because weather stripping can deteriorate over time, it is important to inspect it periodically.

If you suspect a problem with weather stripping, you have several options for checking. Close a door or window on a strip of paper; if the paper slides easily, your weatherstripping isn’t doing its job. Or, close the door or window and hold a lighted candle near the frame. (Don’t let the flame get near anything flammable!) If the flame flickers at any spot along the frame, you have an air leak.

While you’re at it, also check for missing or damaged caulk around windows, doors, and entry points for electrical, cable, phone, gas, and so. Seal any gaps with a suitable caulk.

Video instruction on weatherizing doors and windows

Get on top of roof problems. Few homeowner problems are more frustrating than a leaky roof. Once the dripping starts, finding the source of the problem can be time-consuming. Stop problems this fall before winter and increased precipitation from annoyance into a disaster.

Here’s how: Inspect your roof from top to bottom, using binoculars if necessary. Check ridge shingles for cracks and wind damage. Look for damage to metal flashing in valleys and around vents and chimneys. Scan the entire roof for missing, curled, or damaged shingles. Look in your gutters for large accumulations of granules, a sign that your roof is losing its coating; expect problems soon. Finally, make sure your gutters are flowing freely.

If you are thinking of selling your home and your roof is in need of repair or replacement, start planning this into your budget.  It’s not an expense to ignore and will always be worth the upkeep.  

Silly but informative video with instructions for fixing leaky roof

Walk the walks (and drives). Damaged walkways, drives, and steps are a hazard year round, but their dangers are compounded when the weather turns icy. Fixing problems in the fall is also critical to preventing little problems from becoming expensive headaches.

Look for cracks more than 1/8-inch wide, uneven sections, and loose railings on steps. Check for disintegration of asphalt, or washed-out materials on loose-fill paths.

Most small jobs are well within the ability of a do-it-yourselfer, but save major repairs for experienced hands.

Video instructions for repairing driveway cracks

Chill out.  Although the mild Northwest weather doesn’t see extremes it is still important to take steps to ensure that outside faucets (also called sill cocks) and inground irrigation systems don’t freeze and burst.

Here’s how: Close any shut-off valves serving outside faucets, then open the outside faucet to drain the line. (There may be a small cap on the faucet you can loosen to facilitate this draining.) If you don’t have shut-off valves, and your faucets are not “freeze-proof ” types, you may benefit from Styrofoam faucet covers sold at home centers.

To freeze-proof an in ground irrigation system, follow the manufacturer’s procedure for draining it and protecting it from winter damage.

Freshen your filter. Furnace filters trap dust that would otherwise be deposited on your furnace, woodwork, and so on. Clogged filters make it more difficult to keep your home at a comfortable temperature, and can seriously increase your utility bills. A simple monthly cleaning is all it takes to keep you and your filters breathing free and clear.

Here’s how: Disposable filters can be vacuumed once before replacement. Foam filters can also be vacuumed, but they don’t need to be replaced unless they are damaged. Use a soft brush on a vacuum cleaner. If the filter is metal or electrostatic, remove and wash it with a firm water spray.

Give your furnace a physical. Once a year, it’s a good idea to have your heating system inspected by a professional. To avoid the last-minute rush, consider scheduling this task in early fall, before the heating season begins.

Here are signs that you should have an inspection performed sooner:

Noisy belts. Unusual screeches or whines may be a signal that belts connected to the blower motor are worn or damaged.

Poor performance. A heating system that doesn’t seem to work as well as it once did could be a sign of various problems. Your heating ducts might be blocked, the burners might need an adjustment, or the blower motor could be on its last leg. One check you should be sure to conduct: Make sure your furnace filter is clean.

Erratic behavior. This could be caused by a faulty thermostat or a maladjusted furnace.

Gather round the hearth. Even if you use your fireplace only occasionally, you should check it annually for damage and hazards.

Inspect your flue for creosote. What is Creosote? If you don’t know, I had no idea what it was or that it can be a potential problem…this is WHY we clean the chimney (which we had done only a couple months ago) Creosote is a flammable by-product of burning wood. If it accumulates in a flue or chimney, the result can be a devastating fire. Have your chimney inspected annually for creosote buildup. If you use a fireplace or wood stove frequently, have the flue inspected after each cord of wood burned.

For most people, the best option is to have your entire chimney system inspected by a chimney sweep. Once you know what to look for, you can perform the inspection by shining a bright flashlight up the flue, looking for any deposits approaching 1/8 inch thick. These deposits should be cleaned by an experienced chimney sweep.

Look for flue blockages. Birds love to nest at the top of an unprotected flue. A chimney cap can prevent this from happening. If you don’t have a cap, look up the flu to ensure that there are no obstructions.

Exercise the damper. The damper is the metal plate that opens and closes the flu just above the firebox. Move it to the open and closed positions to ensure that it is working properly.

Check your chimney for damage. Make certain that the flue cap (the screen or baffle covering the top of the chimney) is in place. Inspect brick chimneys for loose or broken joints. If access is a problem, use binoculars.

Keep the humidifier humming. You may know that bone dry winter air is bad for your health, but did you also know it can make fine wood more prone to cracking? You and your home will feel more comfortable if you keep your central humidifier in tip-top shape during the months it is running.

Here’s how: First, inspect the plates or pads, and if necessary, clean them in a strong laundry detergent solution. Rinse and scrape off mineral deposits with a wire brush or steel wool.

Head-off gas problems. Keeping a gas heater in good shape is both a safety and a cost issue. An improperly maintained heater can spew poisons into the air of your home, or it may simply be costing you more to operate. Have a professional check these devices annually. There are also some maintenance items you should address.

Here’s how: First, shut off the heater. Then check the air-shutter openings and exhaust vents for dirt and dust. If they are dirty, vacuum the air passages to the burner and clean the burner of lint and dirt. Follow the manufacturer’s advice for any other needed maintenance.

Keep the wood fires burning brightly. Wood burning stoves are a great way to add atmosphere and warmth to your home. But regular inspections are needed to ensure that these devices don’t become a safety hazard. Here’s how to check them.

Inspect stovepipes. Cracks in stovepipes attached to wood stoves can release toxic fumes into your home. Throughout the heating season, you should check for corrosion, holes, or loose joints. Clean the stovepipe, and then look for signs of deterioration or looseness. Replace stovepipe if necessary.

Look for corrosion and cracks. Check for signs of rust or cracking in the stove’s body or legs.

Check safety features. Make sure that any required wall protection is installed according to the manufacturer’s specifications and that the unit sits on an approved floor material. If you have young children, be sure to fence off the stove when it is in operation.

At least once a year, do a top-to-bottom review of your home’s safety features. This is also a good time to get the family together for a review of your fire evacuation plan. Here’s how to do this:

Smoke and CO detectors. Replace the batteries in each smoke and carbon monoxide (CO) detector, then vacuum them with a soft brush attachment. Test the detectors by pressing the test button or holding a smoke source (like a blown-out candle) near the unit. If you haven’t already, install a smoke detector on every floor of your home, including the basement.

Fire extinguishers. Every home should have at least one fire extinguisher rated for all fire types (look for an A-B-C rating on the label). At a minimum, keep one near the kitchen; having one per floor isn’t a bad idea. Annually, check the indicator on the pressure gauge to make sure the extinguisher is charged. Make certain that the lock pin is intact and firmly in place, and check that the discharge nozzle is not clogged. Clean the extinguisher and check it for dents, scratches, and corrosion. Replace if the damage seems severe. Note: Fire extinguishers that are more than six years old should be replaced. Mark the date of purchase on the new unit with a permanent marker.

Fire escape plans. Every bedroom, including basement bedrooms, should have two exit paths. Make sure windows aren’t blocked by furniture or other items. Ideally, each upper-floor bedroom should have a rope ladder near the window for emergency exits. Review what to do in case of fire, and arrange a safe meeting place for everyone away from the house.

General cleanup. Rid your home of accumulations of old newspapers and leftover hazardous household chemicals. (Check with the state or local Environmental Protection Agency about the proper way to discard dangerous chemicals.) Store flammable materials and poisons in approved, clearly labeled containers. Keep a clear space around heaters, furnaces, and other heat-producing appliances.

Market Monday’s: Kirkland Single Family Homes

photo

Happy Monday! Fall has definitely made its way here, leaves are dropping, rain is sprinkling and the housing market? Well, it’s still trucking right along here in Kirkland. The photo above is from our Sunday night run out Carillon Point in Kirkland, fall here can be quite lovely! The change in seasons typically brings a slight drop in real estate activity, this year however, is proving to be different.  As we adjust to the “new normal” as far as the real estate market goes, if there is one, foreign investors are still driving the market and the economy as well as job growth continues to grow at a healthy pace.

As of September 29th, 2014 there are 160 single family homes for sale in Kirkland, Washington.  The range of list price for these homes range from $265K-$2.2 Million with a median list price of $940K.  When we take a look at the 216 homes that have been sold in the last 90 days, the sale price ranges from $307K-7.5 Million with a median sale price of $750K.  An interesting aspect of this data is that the median “days on market” for the active listings is 80 days, while the median “days on market” for the sold and pending properties is only 17 days.  Why such a big difference? Well, first of all, some of these homes could have been taken off the market and relisted with the intention of creating buzz around the homes again…similar to a grand reopening, a way to invite the backlog of buyers to explore again.  However, what is more likely is that many of the homes that have been on the market for longer are either not priced correctly OR have passed the “sweet spot” for buyer interest.  Currently, Kirkland is at 2.2 months supply of inventory, which is still significantly below what we would call a normal or “healthy” supply, so when I talk about homes sitting on the market, it’s really not long at all when looking at the bigger picture.

We are beginning to see some price drops happening across the board, which I will be talking about in a post later this week.  I will also be talking about how you can add value to your home with simple exterior and interior projects if you are thinking about selling your home, so stay tuned!

Kirkland is still seeing an almost 100% list/sale price, demonstrating the demand for the area.

August 2014 saw 2.3 months of inventory and we are hovering around 2.2 for the month of September as well.  A normal supply is 6 months, we are still operating in a sellers market or an under supply.