One of the things I love about working in Real Estate is the exposure to the many wonderful cities and neighborhoods of the Greater Seattle Area. As a runner and lover of the outdoors, there are many wonderful places to see and explore. It’s amazing what one can see on foot that is easily missed looking out a car window. The city of Woodinville is one of these lovely communities. While it is known mostly for the 50 wineries, there is also an agritourism presence for the foodies and ample recreational opportunities to enjoy.

View from the Sammamish River trail in Woodinville. Chateau Ste. Michelle directly in the background. My husband and I were running and stopped to listen to Santana playing this past summer.

The garden at Willow’s Lodge which also sits next to the HerbFarm … great for a staycation
Now for the market update …
I wrote a blog post about the Woodinville market in July of 2014. At the time, Woodinville was a fairly stable community and while it was still a sellers market with 2.5 months supply of inventory it had not yet seen the “frenzy” market present in other areas. In July of 2014, the median sale price was $525,000 … as of December 2017 the median price is $850,000. While there can be some variation in median sale price month to month due to a small sample size (fewer homes) and the selection of inventory available, times have definitely changed in Woodinville! The graphs and data table below illustrate the changes over time and current market conditions.
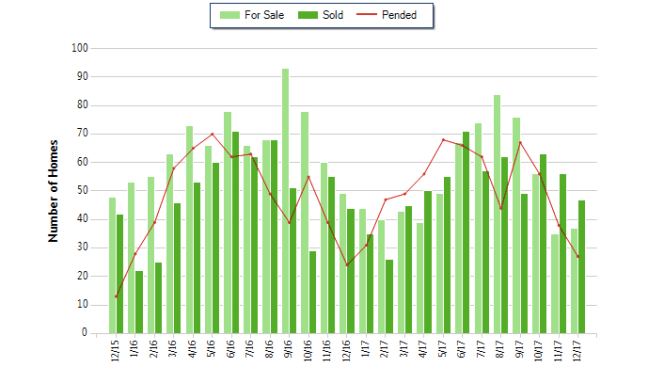
In 2017 there were more homes sold per month then homes for sale. This reflects the lack of inventory and is a contributor to price appreciation. You can see the number of homes for sale has decreased over time, which has become a trend around the Greater Seattle area.

The average price per square foot has increased steadily over time, hovering around $300 per sq ft in December, 2017. While you can’t generalize these numbers, it is another way to get perspective on the market.
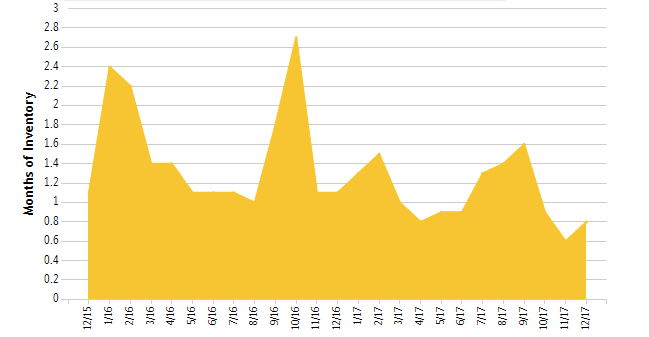
Months of inventory has dropped sharply to its lowest point of 0.6 months supply in November 2017. While it is normal for inventory levels to drop during the winter months, when compared to years prior there are roughly 50% fewer homes available. The data table below displays the specifics in numbers (for the data lovers out there).

The cumulative days on market has also seen a gradual decline. This is likely due again to low inventory and a high demand for homes.

(little tiny numbers – squint away!)

And sometimes, you might see hot air balloons on one of those cherished sunny summer days
